
Electrical Impedance Spectroscopy
Single- and multi-channel impedance analyzers — from compact single-channel workhorses to massive-multichannel research platforms. 100 µHz up to 100 MHz, mΩ…TΩ, in 2/3/4-electrode configurations.
For: Electrical Impedance Spectroscopy is the industry-standard technique for frequency-domain measurement of complex impedance — used across bioanalytics, batteries, materials and medical research.
Where does your EIS work start?
What is Electrical Impedance Spectroscopy?
Electrical Impedance Spectroscopy (EIS) is the industry-standard technique for frequency-domain measurement of complex impedance. Unlike DC resistance or single-frequency AC methods, EIS exploits characteristic time constants to separate bulk conduction, interfacial charge storage, transport limitations and parasitic effects that overlap in the time domain.
Terminology — EIS, dielectric spectroscopy, FRA
Because EIS is applied across diverse fields it appears under several overlapping terms. The underlying measurement is the same; only the experimental configuration changes.
Instrumentation: LCR meters, impedance analyzers, potentiostats
Several instrument classes overlap conceptually with EIS but differ fundamentally in architecture. LCR meters are bridge-based and optimized for passive component testing — they lack potentiostatic control and flexible biasing.
Electrode configurations: 2, 3 and 4-terminal
Incorrect electrode topology is among the most common causes of invalid impedance data. The validity of EIS data is determined by how the instrument couples to the sample.
One technique.
Many measurement regimes.
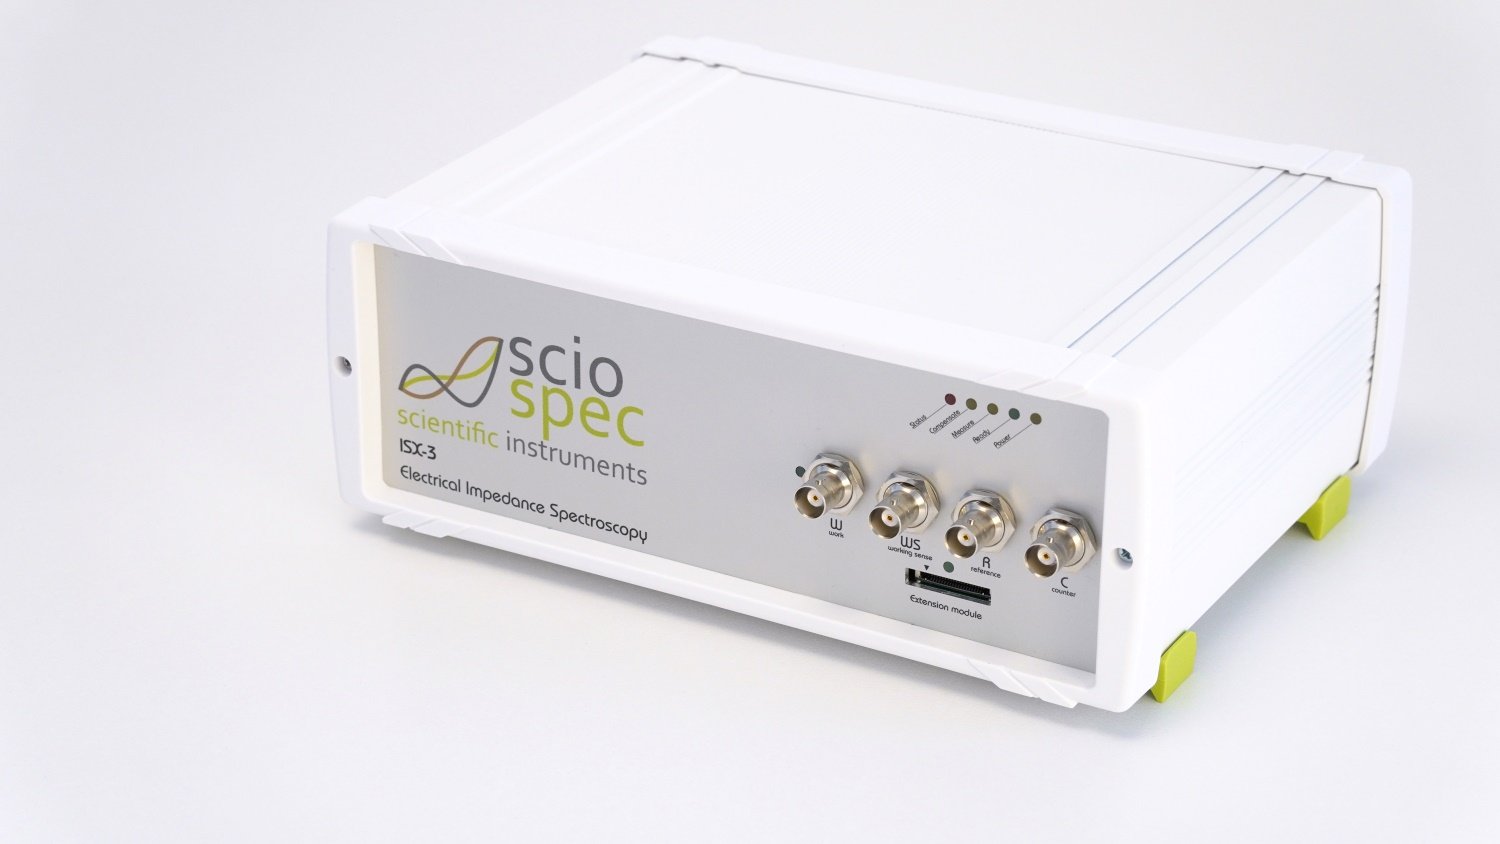
Compact ISX-3 single-channel
Compact ISX-3 single-channel workhorse
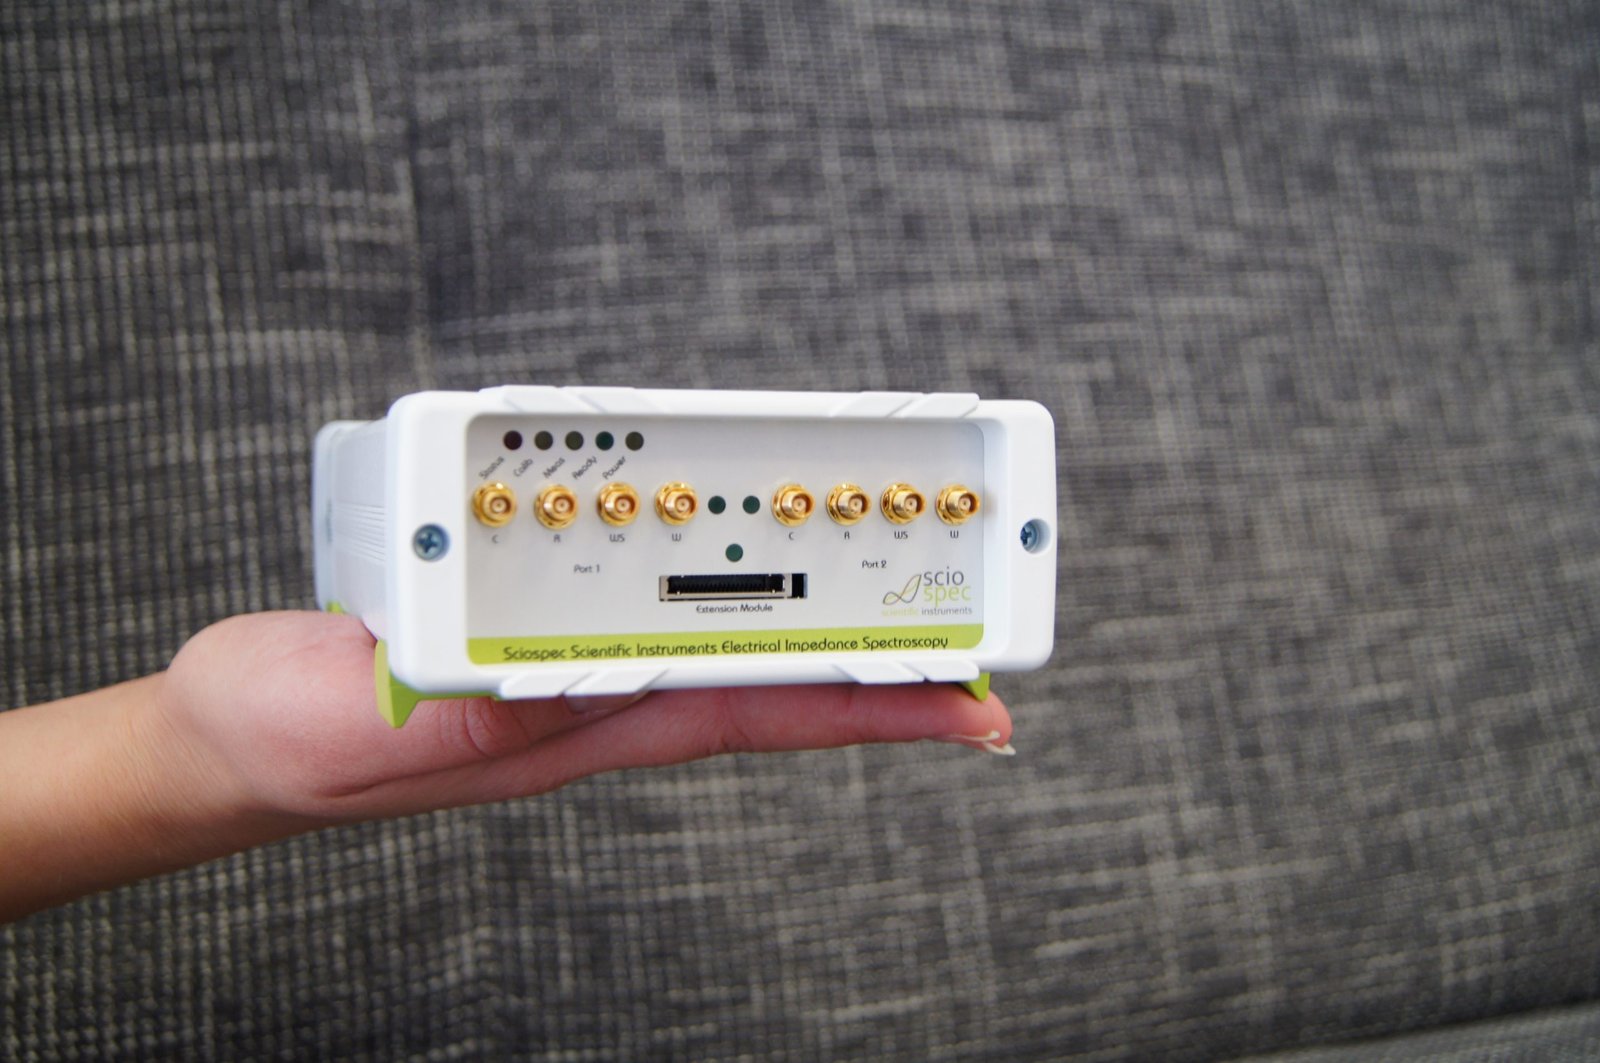
Palm-sized ISX-3mini with
Palm-sized ISX-3mini with two multiplexed channels
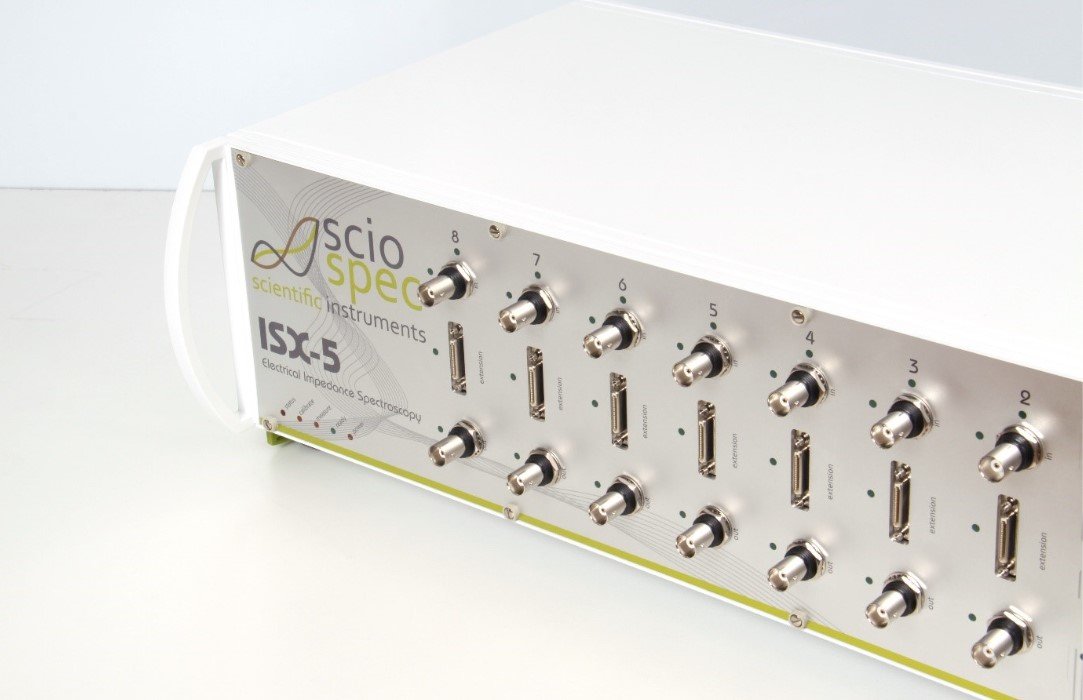
ISX-5 multichannel platform
up to 8 channels per chassis
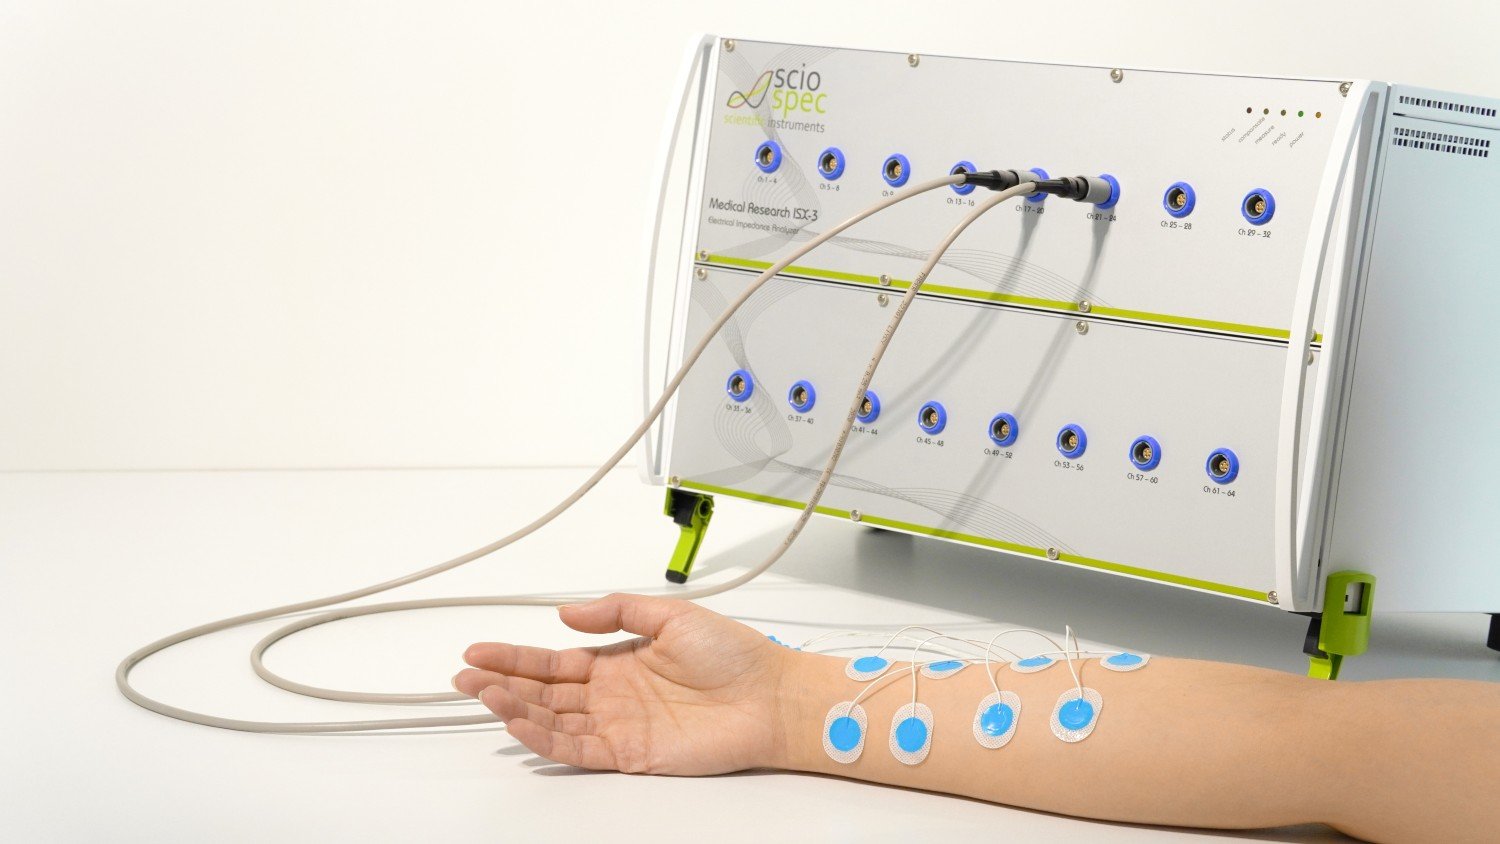
Medical Research ISX-3
Medical Research ISX-3 with IEC 60601-1 safety features
How EIS translates a sample into a spectrum
What is Electrical Impedance Spectroscopy?
Electrical Impedance Spectroscopy (EIS) is the industry-standard technique for frequency-domain measurement of complex impedance. Unlike DC resistance or single-frequency AC methods, EIS exploits characteristic time constants to separate bulk conduction, interfacial charge storage, transport limitations and parasitic effects that overlap in the time domain.
Terminology — EIS, dielectric spectroscopy, FRA
Because EIS is applied across diverse fields it appears under several overlapping terms. The underlying measurement is the same; only the experimental configuration changes.
Instrumentation: LCR meters, impedance analyzers, potentiostats
Several instrument classes overlap conceptually with EIS but differ fundamentally in architecture. LCR meters are bridge-based and optimized for passive component testing — they lack potentiostatic control and flexible biasing.
Electrode configurations: 2, 3 and 4-terminal
Incorrect electrode topology is among the most common causes of invalid impedance data. The validity of EIS data is determined by how the instrument couples to the sample.
The EIS method — in detail
What is Electrical Impedance Spectroscopy?
Electrical Impedance Spectroscopy (EIS) is the industry-standard technique for frequency-domain measurement of complex impedance. Unlike DC resistance or single-frequency AC methods, EIS exploits characteristic time constants to separate bulk conduction, interfacial charge storage, transport limitations and parasitic effects that overlap in the time domain.
Rather than collapsing system behavior into a single scalar, EIS represents the response as a complex, frequency-dependent impedance spectrum. This enables the mathematical separation of overlapping mechanisms — distinguishing immediate bulk conduction from slower diffusion events — without destroying or significantly perturbing the system under test.
Terminology — EIS, dielectric spectroscopy, FRA
Because EIS is applied across diverse fields it appears under several overlapping terms. The underlying measurement is the same; only the experimental configuration changes.
- Electrical Impedance Spectroscopy — frequency-resolved measurement of impedance
- Electrochemical Impedance Spectroscopy — same technique applied to ionic systems
- Dielectric Spectroscopy — broader physics term, materials science focus
- AC Impedance — emphasizes alternating current nature
- FRA (Frequency Response Analysis) — hardware sweeping technique
Instrumentation: LCR meters, impedance analyzers, potentiostats
Several instrument classes overlap conceptually with EIS but differ fundamentally in architecture. LCR meters are bridge-based and optimized for passive component testing — they lack potentiostatic control and flexible biasing.
Impedance analyzers are explicitly designed for frequency-resolved analysis across wide frequency and impedance ranges, with controlled excitation amplitudes and DC biasing. Potentiostats excel at defining electrochemical operating points but typically constrain frequency range and parallelization. Network analyzers target RF/microwave regimes unsuitable for low-frequency biological or electrochemical work.
Electrode configurations: 2, 3 and 4-terminal
Incorrect electrode topology is among the most common causes of invalid impedance data. The validity of EIS data is determined by how the instrument couples to the sample.
- 2-electrode — acceptable only for high-impedance dielectrics
- 3-electrode — adds a reference for controlled bias in electrochemistry
- 4-electrode (Kelvin) — separates current injection from voltage sensing, required for batteries and conductive fluids
- Independent Force / Sense paths are required for mΩ-regime accuracy
Signal-chain artifacts and how to avoid them
Recognizing instrumental artifacts is critical for valid modeling. Apparent inductive features at high frequencies are most often introduced by cabling and connectors rather than the sample under test.
- Inductive tails — caused by cabling inductance above ~100 kHz
- Capacitive shunting — parasitic capacitance shorting high-impedance samples
- Contact resistance — resolved by switching to 4-electrode (Kelvin)
- Kramers–Kronig validation tests causality and linearity
- Excitation amplitude must stay in the linear regime (mV)
Scaling from lab bench to production
Industrial environments rarely tolerate serial measurements. Multiplexing increases channel count but sacrifices simultaneity and introduces parasitic effects along the signal chain. Parallel architectures preserve interpretability but impose strict synchronization requirements.
Purpose-built multi-channel platforms — like the ISX-5 and CSX-64 — integrate these constraints at the hardware level rather than scaling single-channel designs. When EIS becomes a subsystem in a larger product, OEM measurement modules transfer integration risk and lifecycle overhead from the product team to the measurement supplier.
Application examples
EIS is applicable wherever electrical properties encode information about structure, composition or state.
- Materials & dielectrics — bulk and interfacial characterization
- Component testing — capacitors, micro-storage devices, sensors
- Bioanalytics & organ-on-chip — barrier integrity, cell assays
- Batteries & fuel cells — degradation, internal resistance, diffusion
- Electrochemical biosensors — transducer for binding events
- Medical research — bio-impedance with 60601-1 safe front-ends
EIS vs. neighbouring techniques
| Technique | Frequency domain | Best for | Limitation |
|---|---|---|---|
| EIS | 1 µHz – 100 MHz | Complex impedance of any system | Requires quasi-stationarity |
| LCR meter | Discrete spot frequencies | Passive component QA | No bias control, no electrochemistry |
| Potentiostat | DC + limited FRA | Electrochemical operating point | Narrow FRA range, often serial |
| Network analyzer | RF / microwave | Scattering parameters | Poor low-frequency / high-Z |
| EIT | Spatial reconstruction | Conductivity maps in 2D / 3D | Massive electrode arrays required |
Same underlying physics — instrument architecture determines which problems it can solve.
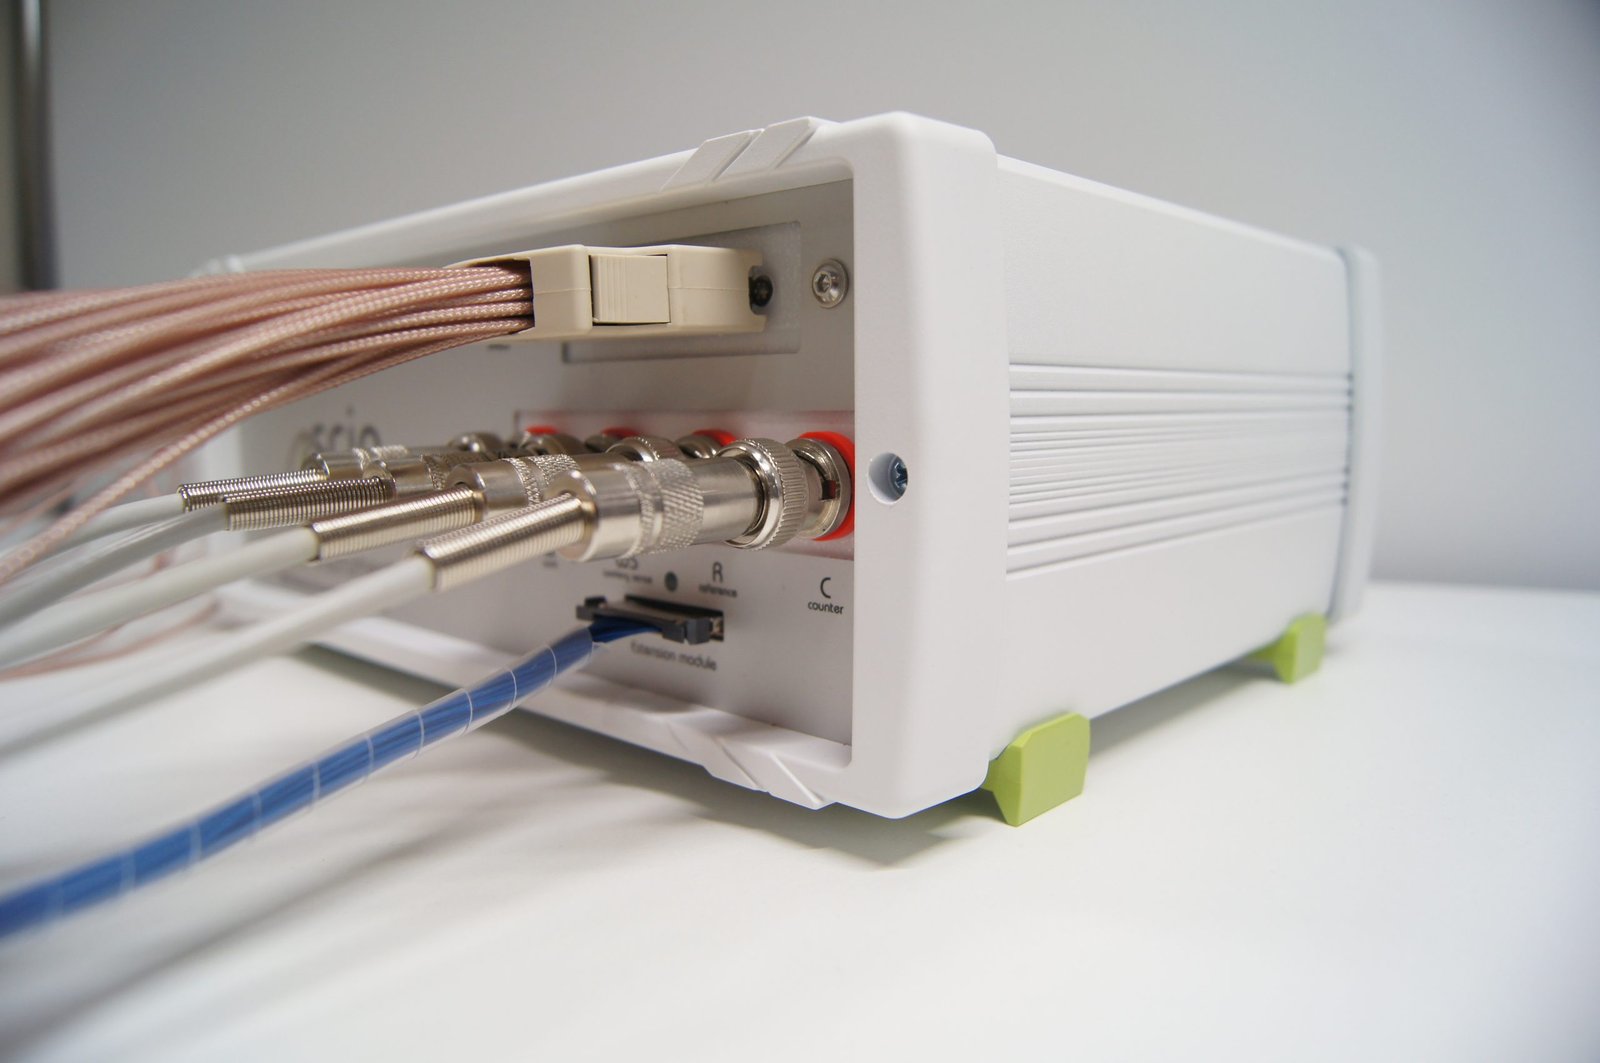
- Palm-sized ISX-3mini with two multiplexed channels
- ISX-5 multichannel platform — up to 8 channels per chassis
- Medical Research ISX-3 with IEC 60601-1 safety features
- ISX-3 EIT combines EIS + EIT in one instrument
- ExtensionPort for custom application-specific front-ends
Table of Contents
Recommended systems
Frequently asked questions
What is Electrochemical Impedance Spectroscopy (EIS)?
EIS measures the complex impedance of a material or electrochemical system over a range of frequencies. A small sinusoidal excitation is applied and the current response is analysed to determine how the system resists or stores energy.
It provides detailed insight into charge transfer, diffusion, double-layer formation and other interfacial processes — making it essential for batteries, biosensors, corrosion research and material interfaces.
When is a four-electrode (Kelvin) configuration strictly required?
Can EIS be scaled beyond single-sample lab setups?
Is EIS suitable for OEM or embedded integration?
Why do high-frequency Nyquist plots often show apparent inductive behavior?
Can EIS be performed on non-stationary systems?
How is EIS data validity assessed beyond visual inspection?
What practically determines the lowest usable frequency?
Why is the Constant Phase Element (CPE) important?
How does EIS compare to Cyclic Voltammetry?
Find the right EIS setup for your measurement
Get in touch with us
Phone
Headquarters
Sciospec Scientific Instruments GmbH
Leipziger Str. 43b
04828 Bennewitz, Germany
Open in Google Maps